Quality engineering software for SPC, DOE, and ISO 9001

Track NCRs, run experiments, monitor processes, and deploy strategy — one platform instead of Minitab + spreadsheets + a separate QMS. 200+ statistical analyses. Free tier available.

200+ analyses · $49/mo vs $2,594/yr Minitab · Calibrated daily against golden-file test cases
Start Free Try Free Tools
ILSSI ILSSI Accredited Partner
Bayesian SPC — Belief Chart, Evidence Accumulation, and E-Detector changepoint detection
Bayesian Cpk Posterior with credible intervals and Taguchi Loss per Regime showing dollar impact
Hoshin Kanri X-Matrix with strategic objectives, annual objectives, improvement projects, and KPIs

Everything quality teams need, connected

Every stage of improvement — from data collection to strategic verification — in one platform.

Measure & Monitor

SPC control charts with Shewhart and Bayesian monitoring. Capability analysis (Cp, Cpk, Pp, Ppk + Bayesian Cpk with credible intervals), Gage R&R, and Nelson rules.

Design Experiments

Full factorial, fractional factorial, Plackett-Burman, CCD, Box-Behnken. Built-in power analysis and response surface optimization.

Analyze & Model

200+ analyses: ANOVA, regression, hypothesis tests, reliability, Bayesian methods, and ML models. Full diagnostics and code generation.

Investigate Root Causes

A3 reports, 5 Whys, FMEA with evidence-based risk scoring, and AI that challenges premature conclusions with counterfactual reasoning.

Track Hypotheses

Bayesian belief engine links evidence to hypotheses. Probability estimates update as experiments complete. Every analysis feeds your decision framework.

Bayesian Process Intelligence

Adaptive control limits that shrink with data. Bayesian Cpk with P(Cpk > 1.33). Online changepoint detection, anytime-valid sequential testing, and Bayesian DOE. No arbitrary 3σ rule. See what it finds →

Deploy Strategy

Hoshin Kanri with a live X-matrix connecting 3-5 year strategic objectives to annual targets, improvement projects, and KPIs. Correlation matrices auto-populate from your data and surface unlinked projects during catchball. Monthly savings tracking with Monte Carlo forecasting. See how it works →

Strategy deployment that runs on real data

Most hoshin kanri implementations are spreadsheets and wall posters. Svend's X-matrix is a live instrument — the bottom half feeds from your operational data, the top half is where leadership judgment lives.

The X-Matrix

The X-matrix is the single artifact where strategy meets execution. Four quadrants, four correlation grids:

  • South: Strategic objectives — 3-5 year breakthrough goals (reduce manufacturing cost 30%, achieve zero-defect on Line 4)
  • West: Annual objectives — this fiscal year's specific targets, each linked to a strategic objective
  • North: Improvement projects — kaizen events and CI projects with live monthly savings tracking, Monte Carlo forecasting, and VSM traceability
  • East: KPIs — measurable indicators that pull actual values directly from project data or manual entry

The four corner grids show how adjacent quadrants relate. Every dot is a strategic alignment decision. The system pre-populates correlations from your actual data relationships — site matching, project-to-KPI derivation, objective hierarchies — then leadership confirms or adjusts during catchball. Humans stay in the loop without doing data entry.

What makes this different

Traditional hoshin tools are top-down goal cascades disconnected from the work. Svend's hoshin is bidirectional — the X-matrix is fed by live data from below and governed by judgment from above.

  • Auto-suggested correlations: The system detects when a project at Site A maps to an annual objective scoped to Site A, or when a KPI derives its actual from a project's YTD savings. These show as dashed outlines until a human confirms them.
  • Unlinked project warnings: Any project with no correlation to an annual objective gets flagged. If it can't justify its existence strategically, leadership sees it immediately. This is the catchball enforcement mechanism.
  • Dollar rollup by strategic objective: Trace from a 5-year goal down through annual objectives, across correlations to projects, and aggregate their savings targets and actuals. One view of whether the strategy is funded and on track.
  • Fiscal year rollover: When January hits, annual objectives clone forward with actuals reset. Strategic objectives persist across their multi-year span. Project-level correlations start fresh — new year, new projects, auto-suggested from the data.
  • VSM lifecycle: Value stream maps are scoped to fiscal years with current/future pairing. Promote a future-state VSM to current when the improvement is verified — metric snapshots carry over, and kaizen bursts show realized savings from linked hoshin projects.

One connected workflow

From understanding your current state to verified performance improvement — every step connected.

Map the Current State
Value stream mapping with real metrics. Cycle time, changeover, uptime, OEE. Identify constraints before committing resources.
VSM Line Simulator
Form & Test Hypotheses
Simulate changes before implementing. "What if we cut changeover by 40%?" Bayesian belief tracking updates as evidence arrives.
Synara Simulators
Set Strategic Priorities
Findings become hoshin priorities. The X-matrix connects 3-5 year strategic objectives to this year's annual targets, with correlation grids auto-populated from your data lineage. Unlinked projects are flagged immediately — if it can't trace to a strategic objective, leadership sees it during catchball.
X-Matrix Hoshin Kanri Catchball
Charter Improvement Projects
Each project connects to a strategic priority. Every analysis lives inside its project context. Traceable, auditable, connected.
Projects A3 Reports
Run the Analysis
200+ analyses including Bayesian SPC with adaptive control limits and P(Cpk > 1.33). DOE, regression, ANOVA, Gage R&R, reliability, ML. AI challenges premature conclusions. Results feed back to hypotheses automatically.
DSW SPC Bayesian DOE RCA
Verify Effectiveness
Did the corrective action move the needle? Re-run the same analysis. Compare before and after. Update the FMEA with real evidence, not opinions.
FMEA Verification
Confirm Strategic Impact
Dollar rollup traces from strategic objectives through annual targets to project-level savings. The X-matrix aggregates actuals across every correlated project. Promote your future-state VSM to current when savings are verified — realized dollars appear on the kaizen bursts that created them. Budget-linked, scorecard-verified, auditable.
X-Matrix Rollup VSM Lifecycle Savings Tracking
The cycle repeats. Your updated VSM shows the constraint is gone. New constraints emerge. New experiments begin. Every cycle builds on the evidence from the last.

We treat our software like a calibrated instrument

You calibrate your gages. We calibrate our statistical engine. Every p-value, Cpk, control limit, and effect size is verified against known correct results with defined tolerance bands. If anything drifts, we know before you do.

84
Golden-file calibration cases
with tolerance bands
28
Automated compliance checks
run daily, SOC 2 aligned
25
Internal standards
400+ machine-readable assertions
Public
Live compliance dashboard
real-time, not curated
Statistical Correctness
Golden-file test cases verify every analysis type against known correct results. Tolerance bands: p-value ±0.005, Cpk ±0.05, correlation ±0.02, control limits ±0.5. Daily 8-case rotation. Monthly calibration certificates. Coverage can only ratchet up, never regress.
Transparent Compliance
28 automated checks run daily against SOC 2 Trust Services Criteria. 25 internal standards with 400+ assertions verified automatically. Hash-chained audit trail. Everything is on our public compliance dashboard — real-time results, not marketing copy.

See live compliance dashboard →

One platform, not five subscriptions

Quality teams typically spend $3,000–$10,000+/yr per seat across separate tools for statistics, DOE, lean project management, and risk analysis. Svend replaces the stack.

Free

Explore the platform

$0 /month
  • 5 analyses per day
  • Basic statistics
  • SPC charts
  • Community support
Start Free

Professional

Full experimentation platform

$49 /month
$588/year — replaces your entire tool stack
  • 200+ analyses incl. Bayesian SPC
  • DOE with response optimization
  • SPC, capability & Gage R&R
  • Hypothesis tracking (Synara)
  • A3, RCA, FMEA & VSM
Get Professional

Team

Shared improvement programs

$99 /seat/mo
  • Everything in Professional
  • Shared projects & dashboards
  • FMEA, A3 & VSM collaboration
  • ISO 9001 QMS: NCR, audits, training
  • Doc control, authoring & export
  • Quality economics (Taguchi, CoQ)
  • Field-level audit trail
  • Knowledge graph
Try Free for 14 Days

Enterprise

Organization-wide deployment

$299 /seat/mo
  • Everything in Team
  • AI assistant (Claude)
  • Hoshin Kanri + X-Matrix
  • Multi-site savings tracking
  • SSO & audit trails
  • Dedicated support & SLA
Contact Sales

Team and Enterprise include a 14-day free trial — no charge until day 15. All plans include unlimited exports. Annual billing available — contact us for volume discounts.

See how Svend compares to Minitab →  ·  Classical vs Bayesian SPC →

ISO 9001:2015 QMS — built in, not bolted on

NCRs, audits, training, document control, supplier management, quality economics, and structured document authoring. Every QMS action creates traceable evidence. Findings auto-create NCRs, NCRs auto-launch investigations, investigations feed back as corrective actions. Closed-loop by default.

10.2
NCR Tracking & CAPA
Full workflow from detection through containment, root cause, corrective action, and verified closure. Severity classification, overdue CAPA alerts, and auto-linked RCA sessions. Every field change tracked.
9.2
Internal Audits
Schedule audits, assign lead auditors, capture findings by type (major NC, minor NC, observation, opportunity). Findings spawn NCRs with one click. Reusable audit checklists with ISO clause mapping.
7.2
Training Matrix
Competence requirements with mandatory flags, renewal frequency, and per-employee records. Expiry alerts, compliance rate dashboards, and gap analysis. Studies can flag training gaps directly.
9.3
Management Review
ISO 9001 9.3.2/9.3.3 inputs and outputs. Auto-captured QMS data snapshot at review time — NCR trends, audit results, training compliance, supplier status — so reviews start with facts, not preparation.
7.5
Document Control
Controlled document register with version history, approval workflow, review scheduling, and retention periods. Draft → Review → Approved → Obsolete lifecycle with full status audit trail.
8.4
Supplier Management
Supplier approval workflow, multi-dimensional evaluation scoring (quality, delivery, price, communication), conditional/suspended/disqualified tracking with reason capture.
7.5
Document Authoring
Structured editor for Quality Manuals, Procedures, Work Instructions, Policies, Specifications, Plans, and Forms. Pre-built templates, drag-and-drop sections, photo and whiteboard embeds. Export to Word and PDF. Publish directly to Document Control.
8.6 · 10.3
Quality Economics
Taguchi loss functions, Cost of Quality (PAF model with prevention optimization), Bayesian process decision theory, and economic lot sentencing. Quantify the cost of variation in dollars, not just sigma.
4–10
QMS Dashboard & Audit Trail
Real-time KPI overview: open NCRs by severity, overdue CAPAs, upcoming audits, training compliance, document review status, supplier evaluations. Field-level change history on every record for compliance audits.

Covers all 32 clauses from 4.1 through 10.3. All active. See full clause coverage →

Try the free ISO Document Creator →  ·  Free Audit Checklist Generator →

QMS features require Team ($99/mo) or Enterprise ($299/mo) plan. 14-day free trial.

Start 14-day free trial →

Questions

What is continuous improvement software?
Continuous improvement software connects statistical analysis (SPC, DOE, capability studies) with structured problem solving (root cause analysis, FMEA, A3 reports) and strategic deployment (hoshin kanri). Instead of using separate tools for each activity, a CI platform keeps the thread from data signal to root cause to corrective action to verified improvement. Svend includes 200+ statistical analyses, Bayesian hypothesis tracking, and project management designed for improvement teams.
How much does a typical quality tool stack cost?
Quality engineering teams typically spend $3,000–$10,000+ per seat per year across separate subscriptions: statistical analysis software ($1,300–$1,900/yr), DOE tools ($500–$2,000/yr), lean/CI project management ($1,200–$3,600/yr), and FMEA/risk analysis tools ($500–$1,500/yr). Svend consolidates all of these into one platform. The Professional plan is $588/year. A free tier is available to evaluate the platform before committing.
What does the AI actually do?
The AI observes your workspace, detects patterns in your data, infers what you're assuming, and challenges your reasoning. It doesn't give you answers — it helps you arrive at structured decisions by asking "have you considered..." and "your evidence shows X but you haven't tested Y." During root cause analysis, it pushes back on premature conclusions with counterfactual challenges.
Can I track experiments and hypotheses over time?
Yes. Svend includes Synara, a Bayesian belief engine for hypothesis tracking. Create hypotheses, link evidence from your statistical analyses and experiments, and watch probability estimates update as new data arrives. Every DOE result, SPC finding, and root cause investigation feeds directly into your hypothesis framework.
How do I know the statistical results are correct?
We treat Svend like a calibrated measurement instrument. 84 golden-file test cases verify statistical outputs against known correct results — every p-value, Cpk, control limit, and effect size checked against defined tolerance bands (p-value ±0.005, Cpk ±0.05, correlation ±0.02). Eight cases run daily on rotation. Monthly calibration certificates record full results. If any analysis drifts outside tolerance, a DriftViolation is created automatically and the issue is flagged before it reaches users. Coverage can only ratchet up — never regress. Everything is visible on our public compliance dashboard, including the raw pass/fail results. We also maintain 25 internal standards with 400+ machine-readable assertions, all verified automatically.
Is my data private?
Yes. Your data stays on our servers (encrypted at rest and in transit), never shared, never used for training. Export or delete anytime. Enterprise customers can run on-premises.
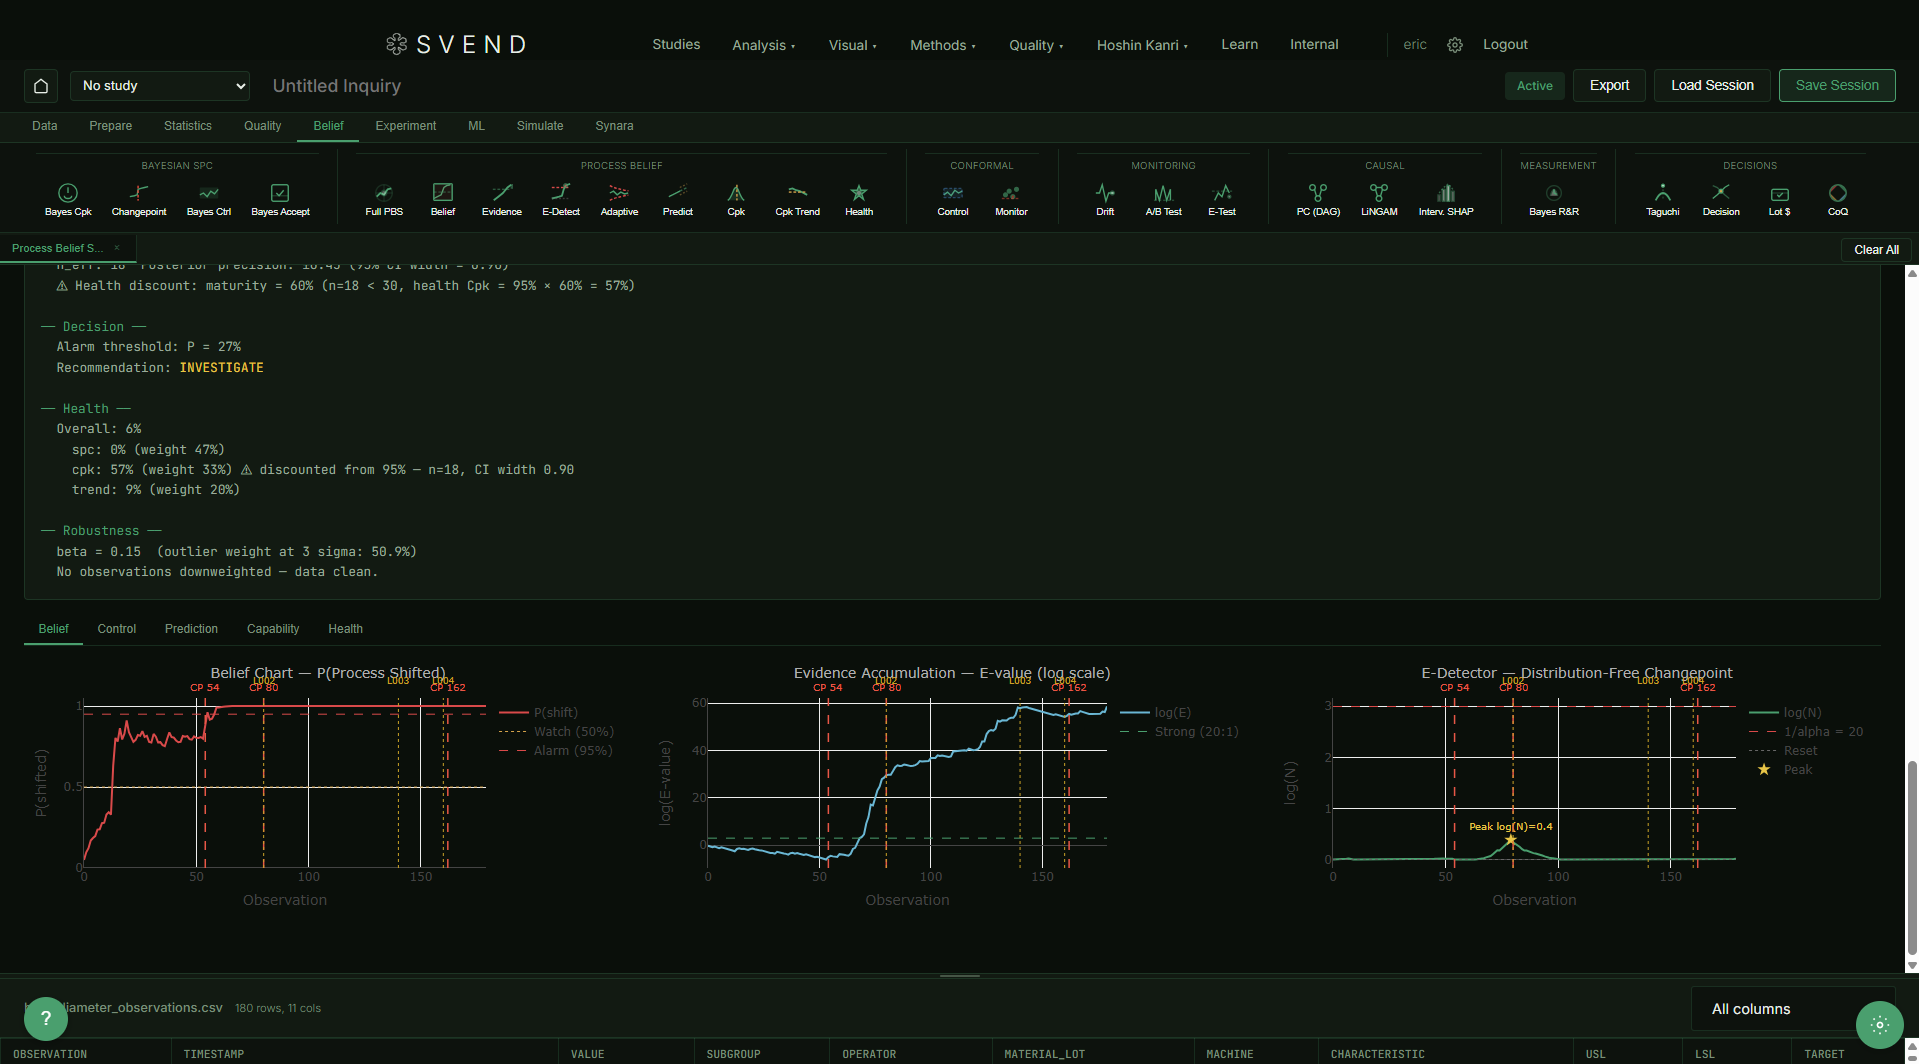
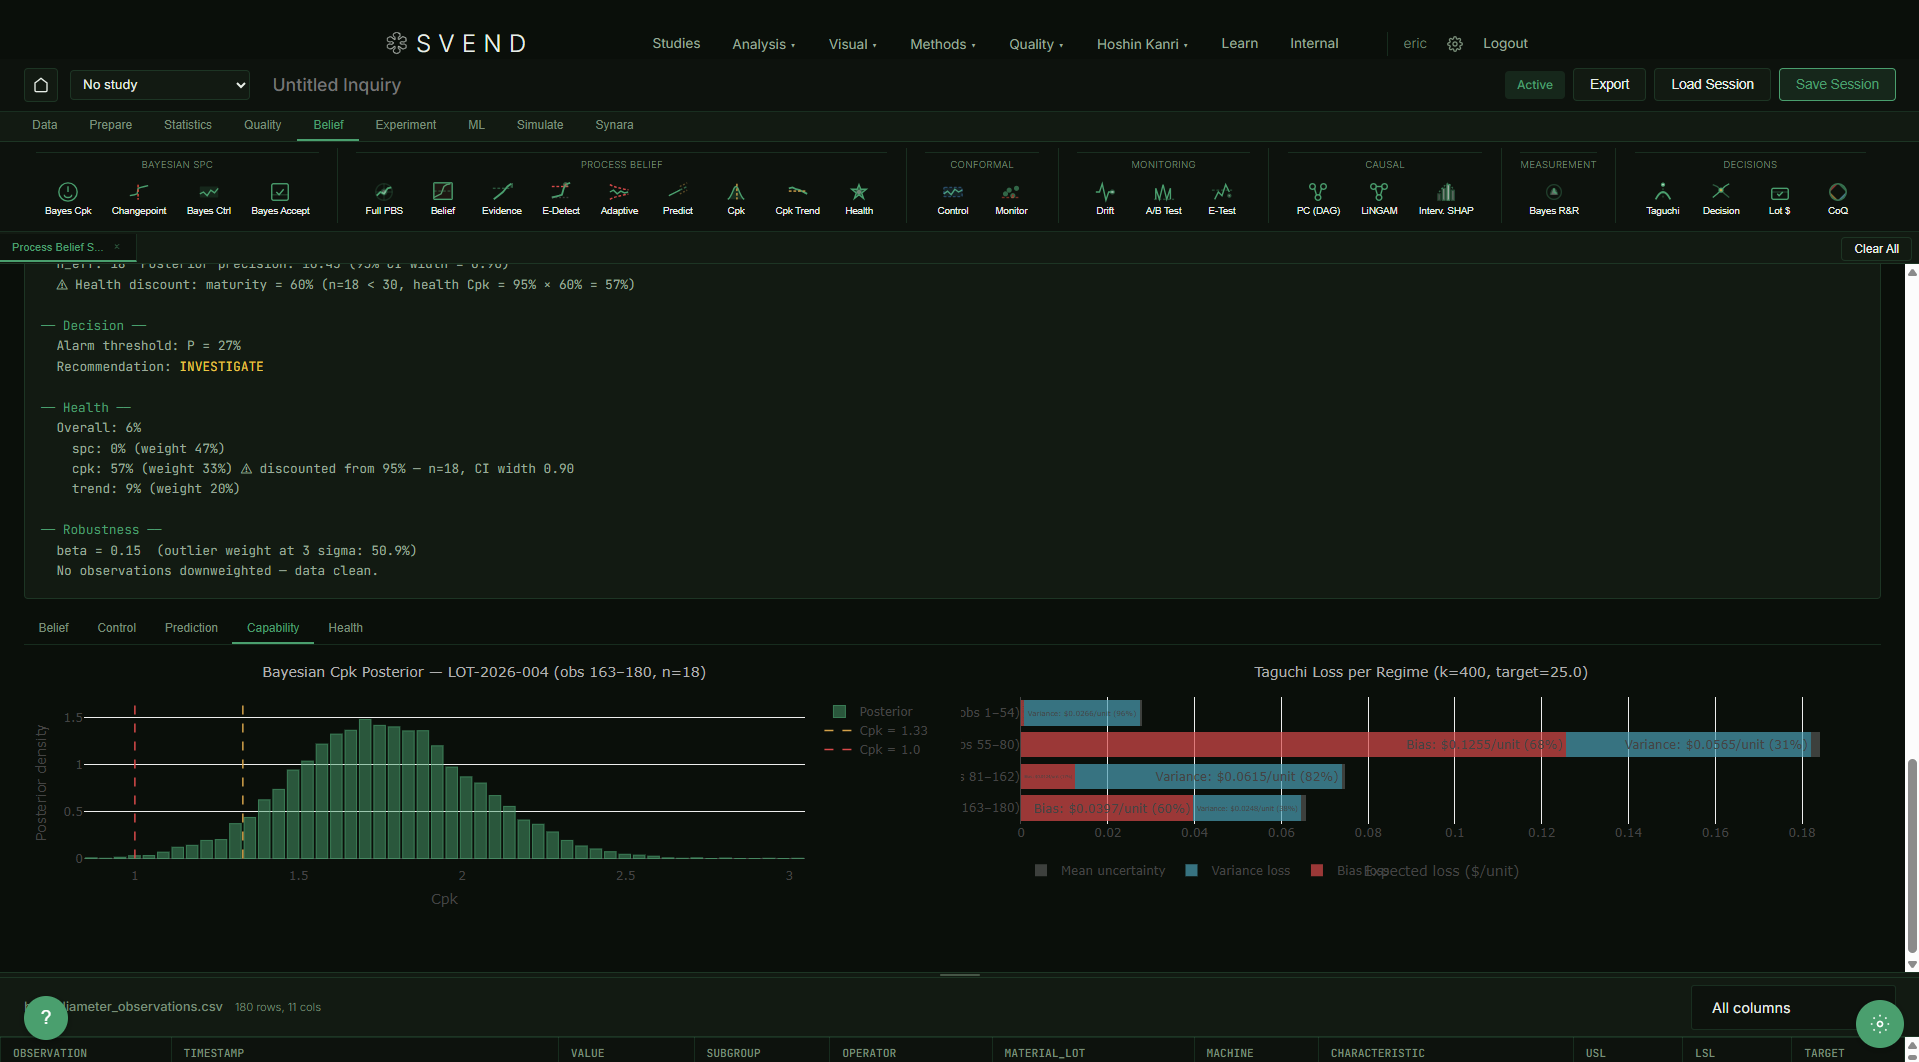
What is Bayesian SPC and how is it different from traditional SPC?
Traditional SPC uses fixed 3-sigma control limits and point estimates. Bayesian SPC replaces these with probability-driven monitoring: adaptive control limits that tighten as data accumulates, Bayesian Cpk that gives P(Cpk > 1.33) instead of a single number, online changepoint detection that identifies shifts observation by observation, and anytime-valid sequential testing with no peeking penalty. Svend is the only platform with a full Bayesian Process Belief System. Try the free Bayesian Cpk calculator.
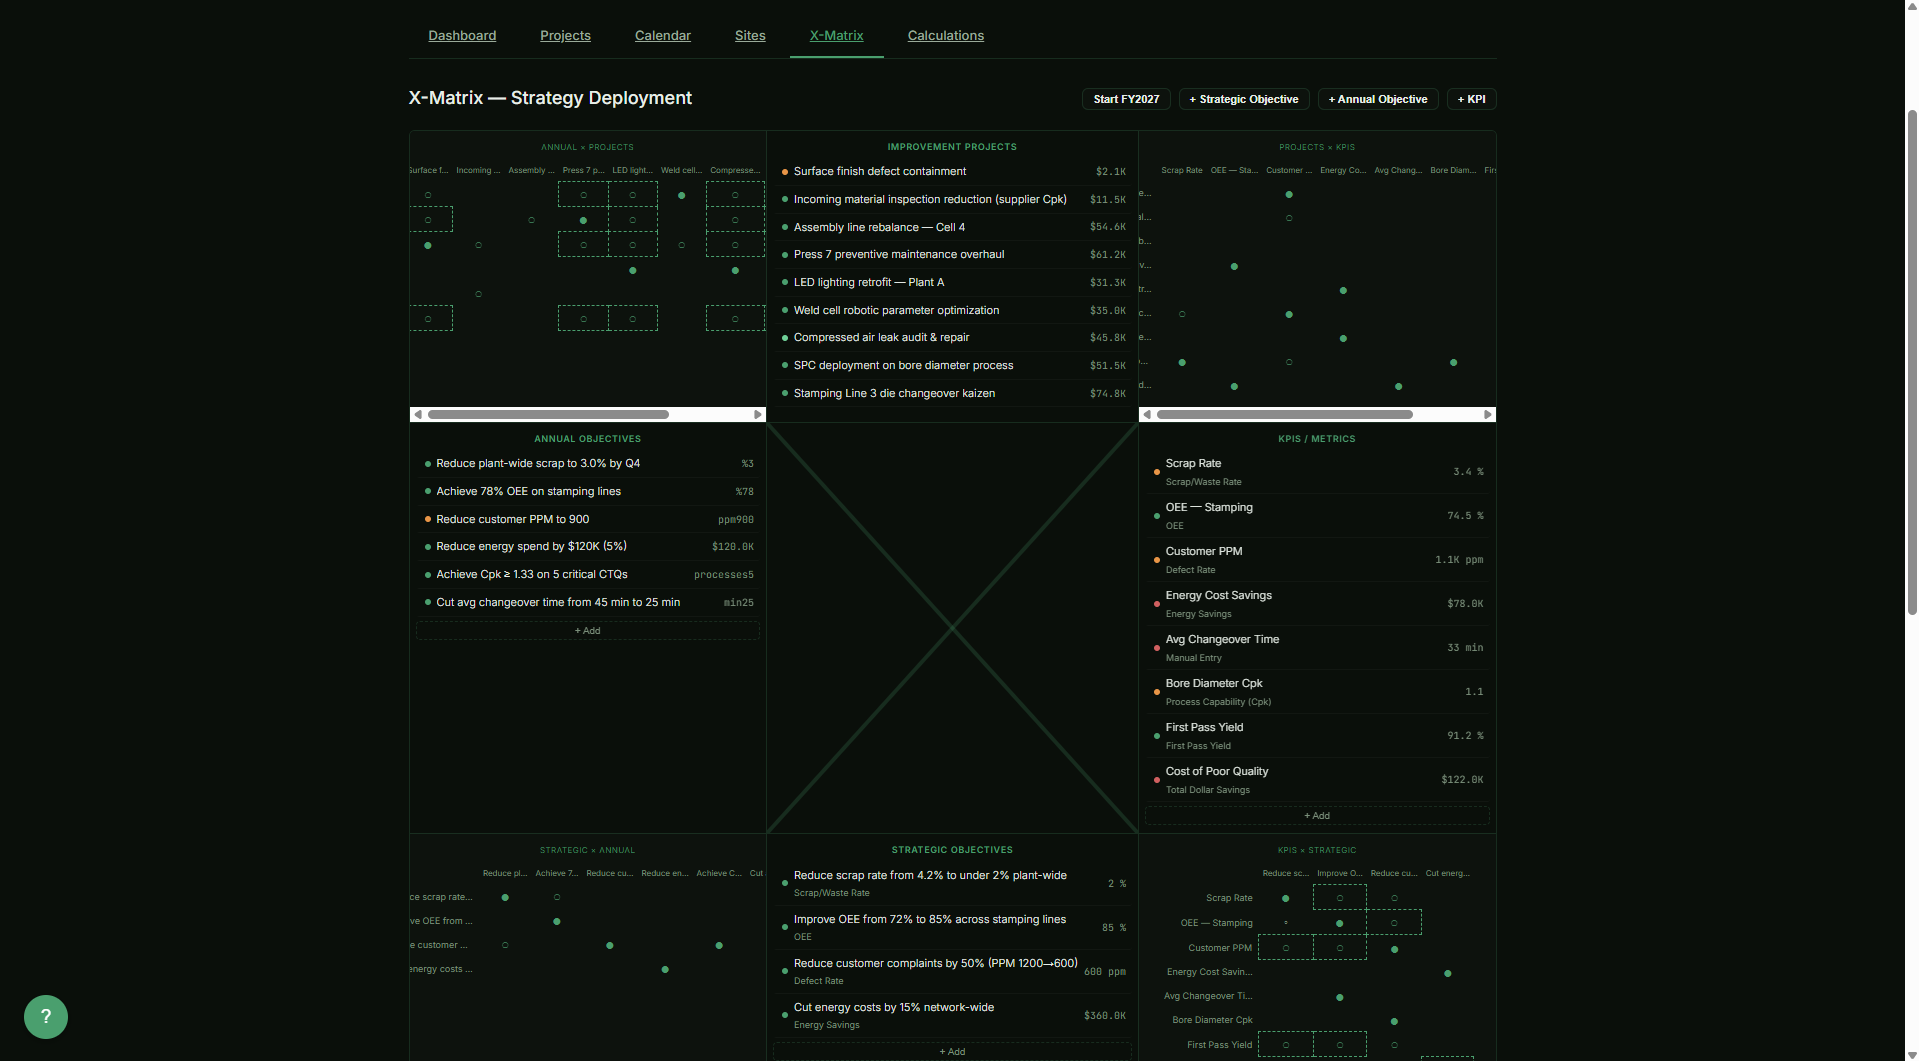
What is the X-matrix and how does Svend implement it?
The X-matrix is the core artifact of hoshin kanri (strategy deployment). It's a single document with four quadrants — strategic objectives (3-5 year), annual objectives (this fiscal year), improvement projects, and KPIs — connected by correlation grids that show how each quadrant relates to its neighbors. In most organizations, the X-matrix is a static spreadsheet or a poster on the wall. In Svend, it's a live instrument. The bottom two quadrants (projects and KPIs) are fed by real operational data — monthly savings actuals, Monte Carlo forecasts, value stream metrics. The top two quadrants (strategic and annual objectives) are where leadership sets direction. The correlation grids in between auto-populate from data lineage: if a project lives at Site A and an annual objective is scoped to Site A, the system suggests the link. If a KPI derives its actual value from a project's YTD savings, the system knows. Humans confirm or override during catchball. Click a dot to cycle through strong, moderate, weak, or remove it. The system also flags any project that has no correlation to an annual objective — if a project can't trace to strategy, leadership sees it immediately.
How does Svend connect value stream mapping to hoshin kanri?
Value stream maps in Svend are scoped to fiscal years and paired as current-state and future-state. Kaizen bursts on a VSM can be promoted to hoshin projects with savings targets and monthly tracking. When the improvement is verified and you promote the future-state VSM to become the new current state, metric snapshots carry over and the kaizen bursts show the realized savings from their linked hoshin projects. The constraint you eliminated on the VSM traces to the dollars captured in the hoshin, which rolls up to an annual objective, which maps to a strategic objective on the X-matrix. That's the full loop — from process observation to strategic verification — without leaving the platform or copying data between systems.
Does Svend support ISO 9001:2015 compliance?
Yes. The Team and Enterprise plans include a full ISO 9001:2015 QMS covering all 32 clauses from 4.1 through 10.3. Core modules: NCR tracking with CAPA workflow (10.2), internal audit scheduling with reusable checklists and finding management (9.2), training matrix with competence records, expiry tracking, and gap analysis (7.2), management review with auto-captured QMS data snapshots (9.3), document control with version history and approval workflow (7.5), supplier management with multi-dimensional evaluation scoring (8.4), and structured document authoring for Quality Manuals, SOPs, Work Instructions, Policies, and Forms with Word and PDF export. Quality economics tools (Taguchi loss, Cost of Quality) quantify variation in dollars. Every field change is tracked for audit trail compliance. Audit findings auto-create NCRs, NCR investigations auto-create studies, study results feed back as corrective actions — closed-loop by design. See the full clause coverage table.
Can I cancel anytime?
Absolutely. No contracts, no commitments. Team and Enterprise plans include a 14-day free trial — cancel during the trial and you won't be charged. After that, cancel with one click and keep access until the end of your billing period.